One day I woke up and had like 14 clusters in my Kubeconfig. I didn’t remember which ones did what or if the clusters even still existed.
kubectl config get-contexts -o name | xargs -I {} kubectl --context={} get nodes -o wide
So I cooked up this command to run through them all and make sure they actually responded. This works for me. If you have an alternative way please share in the comments.
OpenStack administrators have to deal with a lot, including, potentially, many different storage backends in Cinder. Pure Storage now make it easier for them to see what is going on with their Pure FlashArray backends.
With so many different storage backends available to OpenStack Cinder administrators who want to understand how their Cinder backends are being utilized have, historically, had to log on to every backend and therefore need to be conversant with all the vendor-specific storage frontends they have in their environment. The OpenStack Horizon GUI is complex enough, without having to learn other GUIs.
Additionally, OpenStack tenants who are interested in their storage utilization and performance have no way of getting this information without raising internal tickets for their storage support teams – and we all know how long those can take to get answered…
Well, Pure Storage has tried to alleviate these problems by providing an OpenStack plugin for Horizon.
From an OpenStack administrators perspective give a high level view of the utilization levels of Pure Storage FlashArrays configured as Cinder backends, and the tenants it will provide real-time volume utilization and performance information.
So what do you get with the plugin?
For the Administrator, there is a new Horizon panel in the Admin / System section called Pure Storage.
In this new panel you get a simple view of your FlashArray backends in the well-known Horizon format. Interesting information such as overall data reduction rates (with and without thin-provisioning included) is given as well as utilization levels against array limits – useful to see for both OpenStack dedicated arrays and those that have multiple workloads.
If you select the actual array name in the table a new browser tab will open at the actual FlashArray GUI if you want to log in directly, however if you select the Cinder Name in the table you get a detailed view of the array in Horizon providing more capacity and performance information.
The Overview pie charts in this detailed view show the array specific limits for this array, so will be different depending on the Purity version of the FlashArray.
If you aren’t an Administrator and just a regular Tenant in OpenStack, you won’t see these options available to you, but you will be able to get more detail on any volumes are using that are backed by Pure Storage FlashArrays.
By selecting a Pure backed volume in your Volumes page you will get enhanced detail information around the utilization, data reduction and performance of your volume. This data is current, so a refresh of the page will update these statistics.
Hopefully, OpenStack Admins and Users will find this new Horizon plugin useful.
To get more details on installing and configuring check out this GitHub repo.
I do a lot of CLI demos when showing off PSO and K8s and Helm and all the cool things they can do. I made the switch to ZSH and oh my zsh and I really like using it for the past year.
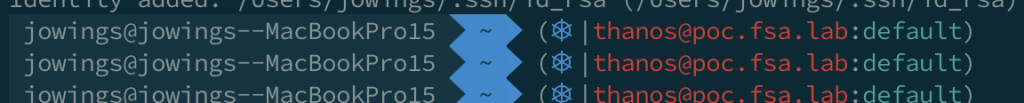
After trying a few different themes and prompts I settled on the following using the “Agnoster” theme for oh-my-zsh. I added the kube-ps1 plugin so I can see what cluster I am using.
Pretty sweet prompt
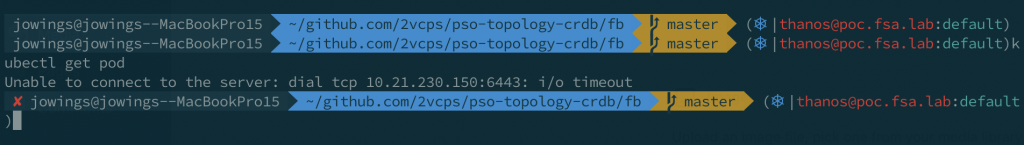
One annoyance is getting when I am in some github repo for a demo deploying containers and ingresses and stuff the prompt gets so long the wordwrap on iTerm window makes me crazy.
I don’t even know what I am typing anymore
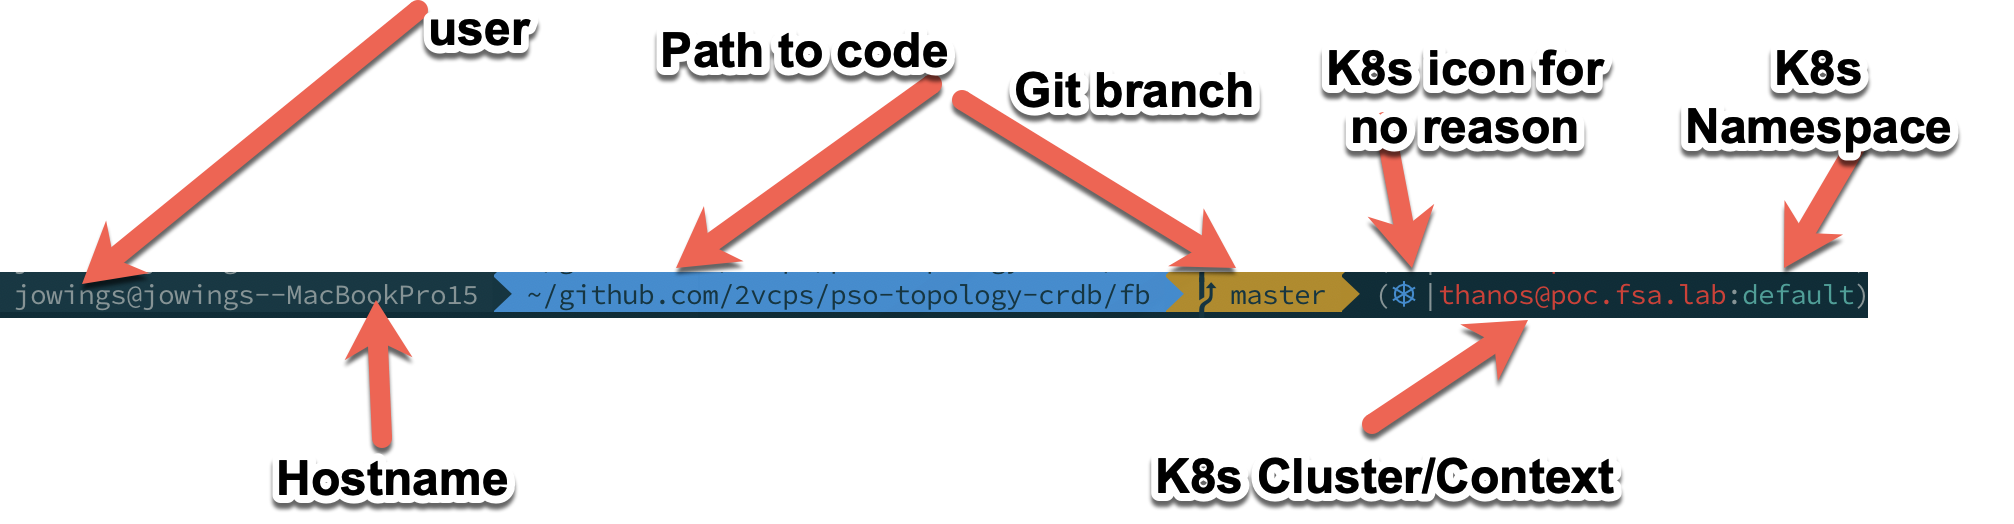
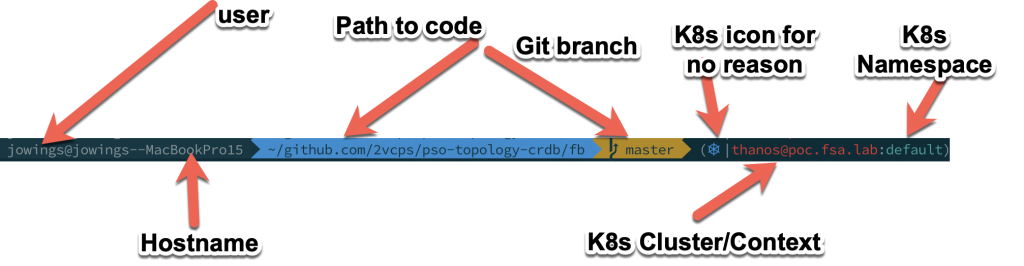
Break down of my full prompt
User name – good to know, I have cloud instances that are ‘ubuntu’ or ‘ec2-user’ so this helps me know what I am working on.
Hostname – I can shorten this, but there is a jamf policy on this machine that sets it back to this monstrosity. I mean, really who forces the username into the hostname?
Path to code – Do I need to see this full path all the time? Probably not.
Git Branch – Good to know when I am coding.
K8s Icon – Non-negotiable. It is awesome.
K8s Cluster/Context – I currently am testing 9 versions of K8s and different clusters. This keeps me sane.
K8s Namespace – This for me is nearly always default since I use kubectl -n <namespace> to do things in namespaces.
I saw someone with a different shell with the cool shorthand path and I felt like that should be an option for my prompt. I like everything else about the agnoster theme. So how can I fix it.
Of course it is a function that calls a bunch of others and “prompt_dir” is the one we want to edit.
Change it from this:
prompt_dir() {
  prompt_segment blue $CURRENT_FG '%~'
}
To this:
prompt_dir() {
  SHORT=$(shrink_path -f)
  prompt_segment blue $CURRENT_FG $SHORT
   }
Now we are using “shrink_path -f” to shorten the directories in the path and storing it in the SHORT variable. Then displaying it in the same spot as full path was before.
Look at how that path was shortened! So far this is working for me on:
Sometimes I have to look up information and I think that is so simple I shouldn’t blog about it. Then I think I should share the link so if anyone else finds it, I might be helpful. Today the 2nd one wins.
I just want to note that the alarm comes at like 180 days, which is super nice but the renewed cert is only good for 364 more days. This can not be changed right now. I suggest though for the ease of use renew the certificate before it expires to avoid extra work.
There was a question on twitter and I thought I would write down my process for others to learn from. First, a little background. Kubernetes is managed mostly using a tool called kubectl (kube-control, kube-cuddle, kube-C-T-L, whatever). This tool will look for the configuration to talk to the API for kubernetes management. A sanitized sample can be seen by running:
You can see there is Clusters, Contexts and Users. The following commands kubectl config get-context and use-context allow you to see and switch contexts. In my use case I have a single context per cluster.
kubectl config get-context
CURRENT   NAME                          CLUSTER      AUTHINFO           NAMESPACE
*         I-AM-GROOT@k8s-ubt18          k8s-ubt18    I-AM-GROOT
          k8s-dev-1-admin@k8s-dev-1     k8s-dev-1    k8s-dev-1-admin
          k8s-lab-1-admin@k8s-lab-1     k8s-lab-1    k8s-lab-1-admin
          k8s-prod-1-admin@k8s-prod-1   k8s-prod-1   k8s-prod-1-admin
kubectl config use-context k8s-dev-1-admin@k8s-dev-1
Switched to context "k8s-dev-1-admin@k8s-dev-1".
Switching this way became cumbersome. So I now use a tool called kubectx and with it kubens. https://github.com/ahmetb/kubectx. Now you can see below my prompt shows my cluster + the namespace. Pretty sweet to see that and has saved me from removing deployments from the wrong cluster. “k8s-dev-1-admin@k8s-dev-1:default”
Now the kubectl tool will look in your environment for a variable KUBECONFIG. Many times this will be set to KUBECONFIG=~/.kube/config . If you modify your .bash_profile on OSX or .bashrc in Ubuntu(and others) you can point that variable anywhere. I formerly had this pointed to a single file for each cluster. For example:
This worked great but a few 3rd party management tools had issues switching between multiple files. At least for me the big one was the kubernetes module for python. So I moved to doing a single combined config file at ~/.kube/config
Now what do I do now?
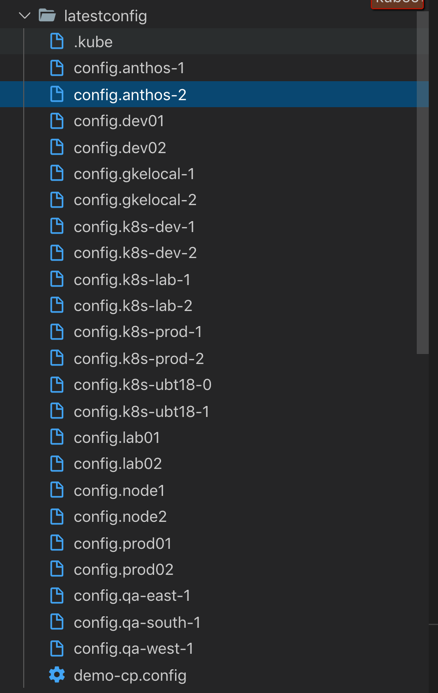
so many configs
Here is my basic workflow. I don’t automate it yet as I don’t want to overwrite something carelessly. 1. Run an ansible playbook that grabs the admin.conf file from /etc/kubernetes on the masters of the cluster. 2. Modify manually the KUBECONFIG environment variable to be KUBECONFIG=~/.kube/config:~/latestconfig/new.config 3. Run kubectl config view –raw to make sure it is all there the –raw tag unhides the keys and such. 4. COPY the ~/.kube/config to ~/.kube/config.something 5. Run kubectl config view –raw > ~/.kube/config 6. Open a new terminal to use my original env variable for KUBECONFIG and make sure all the clusters show up. 7. Clean up old config if I am feeling extra clean.
Not really hard or too complicated. I destroy clusters pretty often so sometimes I will blow away the config and then remerge my current clusters into a new config file.
Experimenting with Kubernetes to orchestrate and manage containers? If you are like me and already have a lot invested in vSphere (time, infra, knowledge) you might be exctied to use Kubernetes Anywhere to deploy it quickly. I won’t re-write the instruction found here:
The vSphere option uses the Photon OS ova to spin up the container hosts and managers. So you can try it out easily with very little background in containers. That is dangerous as you will find yourself neck deep in new things to learn.
Don’t turn on the template!
If you are like me and *skim* instructions you could be in for hours of “Why do all my nodes have the same IP?” When you power on the Photon OS template the startup sequence generates a machine ID (and mac address). So even though I powered it back off, the cloning processes was producing identical VM’s for my kubernetes cluster. Those not hip to networking this is bad for communication.
Also, don’t try to be a good VMware Admin cad convert that VM to a VM Template. The Kubernetes Anywhere script won’t find it.
IF you do like me and skip a few lines reading (happens right) make sure to check this documenation out on Photon OS. It will help get you on the right track.
So lets say the power goes out and half of the vm’s on your “lab storage that uses local disks” go into an infinite BSOD loop. I was lucky as one of the servers that still worked was a AD Domain Controller with DNS. Since I usually don’t try to fight BSOD’s and just rebuild. I did so. One very helpful page to move the AD roles was this article on seizing the roles. Which I had to do since the server holding the roles was DOA.
A few months back I posted a powershell script to post Pure Storage data directly into VMware vCenter Operations Manager (now called vRealize Operations). Inspiration hit me like a brick when a big customer of mine said, “Do you have a plugin for Splunk?”
He already wrote some scripts in python to pull data from our REST API. He just said, “Sure wish I didn’t have to do this myself.” I took the hint. Now I am not a python person, so I did the best I could with the tools I have.
You will notice that the script is very similar to the one I wrote for vCOPS. That is because open REST API’s rock, if you don’t have one for your product you are wrong. 🙂
Like before I schedule this as a task to run every 5 minutes. That seems to not explode the tiny Splunk VM I am running in VMware Fusion to test this out.
Dashboards. Check.
Some very basic Dashboards I created. I am not a Splunk ninja, perhaps you know one? I am sure people that have done this for a while can pull much better visuals out of this data.
Pivot Table
Stats from a Lab array some Averages computed by Splunk.
Gauge Report of Max Latency (that is micro seconds)
A 1000 of these is 1 millisecond 🙂 pretty nice.
From Wikipedia
A microsecond is an SI unit of time equal to one millionth (0.000001 or 10−6 or 1/1,000,000) of a second. Its symbol is μs. One microsecond is to one second as one second is to 11.574 days. A microsecond is equal to 1000 nanoseconds or 1/1,000 milliseconds.
Even if everything else didn’t help you at least you learned that today. Right?
Have 25 Vlans in your lab and Storage, Servers, Switches and other equipment all over the place?
Build a good Ubuntu box
If you need more help on this leave some comments. It is pretty straight forward.
Be sure to select openssh server as a role.
After you login:
Remember to
$sudo apt-get update
$sudo apt-get upgrade
#If you are adventurous
$sudo apt-get dist-upgrade
Install VMware Tools (you ARE doing this in a VM right?)
From your VI Client set the VMware tools install to start, this will insert the disk for VMware Tools, but unfortunately doesn’t automate the install.
$sudo -s
#apt-get install build-essential
#apt-get install
#apt-get install apache2
The last two steps might not be needed but I do them out of habit. They allow the VMware tools to build the Kernel modules needed for VMXNET drivers.#mount /dev/cdrom /mnt/cd
#cp /mnt/cd/VMwareTools-8.6.0-425873.tar.gz
#tar xvzf /tmp/VMwareTools-8.6.0-425873.tar.gz
#cd vmware-tools-distrib
#./vmware-install.pl
Now Run through the install of VMware tools.#apt-get install nmap
#apt-get install gitweb
#exit
You want to do some of the next steps as your normal user not root.
$cd ~
$mkdir nmaps
$git init nmaps
$sudo vi /etc/gitweb.conf
Modify the project root var to match your path to you nmaps.
Now restart apache.
$sudo /etc/init.d/apache2 force-reload
Ok great, the webpage will be up at http://yourhost/gitweb
<update> The above command is to scan a subnet with pings then dump the output to a file.</update>
Nmap – great network scanner, the -sP sets it to “Ping” mode, you don’t need to crawl ports or anything so ping is fine, it will resolve the DNS if that is working.
my example:
$nmap -sP 172.10.0.0/16 -oG /home/lab-admin/nmaps/vlan10.map
For what it is worth a /16 network takes forever. If you know the usable ip’s are a way smaller subset you can specify a range.
$nmap -sP 172.10.0.1-100 -oG /home/lab-admin/nmaps/vlan10.map
Next on the first time you must add the file to the git repository
$cd nmaps
$git add /home/lab-admin/nmaps/vlan10.map
$git commit -m “My Network Maps”
Now we have some content on the gitweb page.
Click tree to see the files you have added.
Click on blob to see your IP’s in use.
Let’s automate it with crontab
As you can see it is fairly easy to get rolling. Before you finish, run the nmap command for each subnet and git add each file to the repository.Now we will tell cron to run the nmap scans on a regular interval and git commit the changes.
$vi ip-scanscript.sh
In this file put each ip scan on its own line. As seen above. Save the changes and exit.
$chmod +x ip-scanscript.sh
$./ip-scanscript.sh
This will create all the files you want in one swoop.
$cd nmaps
$git add *
This will add all the new files in the nmaps directory to the git repository.Edit the script one more time.
$vi ip-scanscript.sh
By adding the git commit line to the script you can now set this up to automatically run with cron.
$crontab -e
[note]I was having issues with the range line in the screenshot above. Still testing.
[2nd note] change the git commit line to include a ‘-a’ example:
So to be 100% honest I have had this book on my desk for several months. Just staring at me. Calling my name. VMware press provided this copy to me along with Mike Laverick’s SRM book and so I am finally going to review the first one.
Cody Bunch does an amazing job of breaking down one of the most mystifying yet powerful products hidden in the VMware portfolio. VMware vCenter Orchestrator is almost mythical in the promises of automation of typical tasks of a vSphere administrator. While you can bang your head against the wall for weeks trying to figure out how to properly setup the vOrchestrator server and client I was able to use Cody’s guidance to have to operational and running test workflows in just a few hours (I am a slow reader).
I can’t stress enough the need for automation and orchestration in today’s virtual machine environment. The business is demanding more and more from the Virtualization team and in order to deliver vCenter Orchestrator is a good start since you probably already OWN it.
Hopefully soon there will be an update with information on the vApp version of Orchestrator. Check it out here on Amazon or your favorite book reseller.